Risk:Reward Calculator
See how a proper risk:reward profile changes your results over time. Powered by Monte Carlo simulation — 500 randomized scenarios of a full trading year.
Try the Full Interactive Calculator
Adjust your R:R ratio, win rate, risk per trade, and trade frequency. Watch 500 simulated equity curves update in real time.
Open Calculator — FreeNo credit card required. Available in the Tools section after signup.
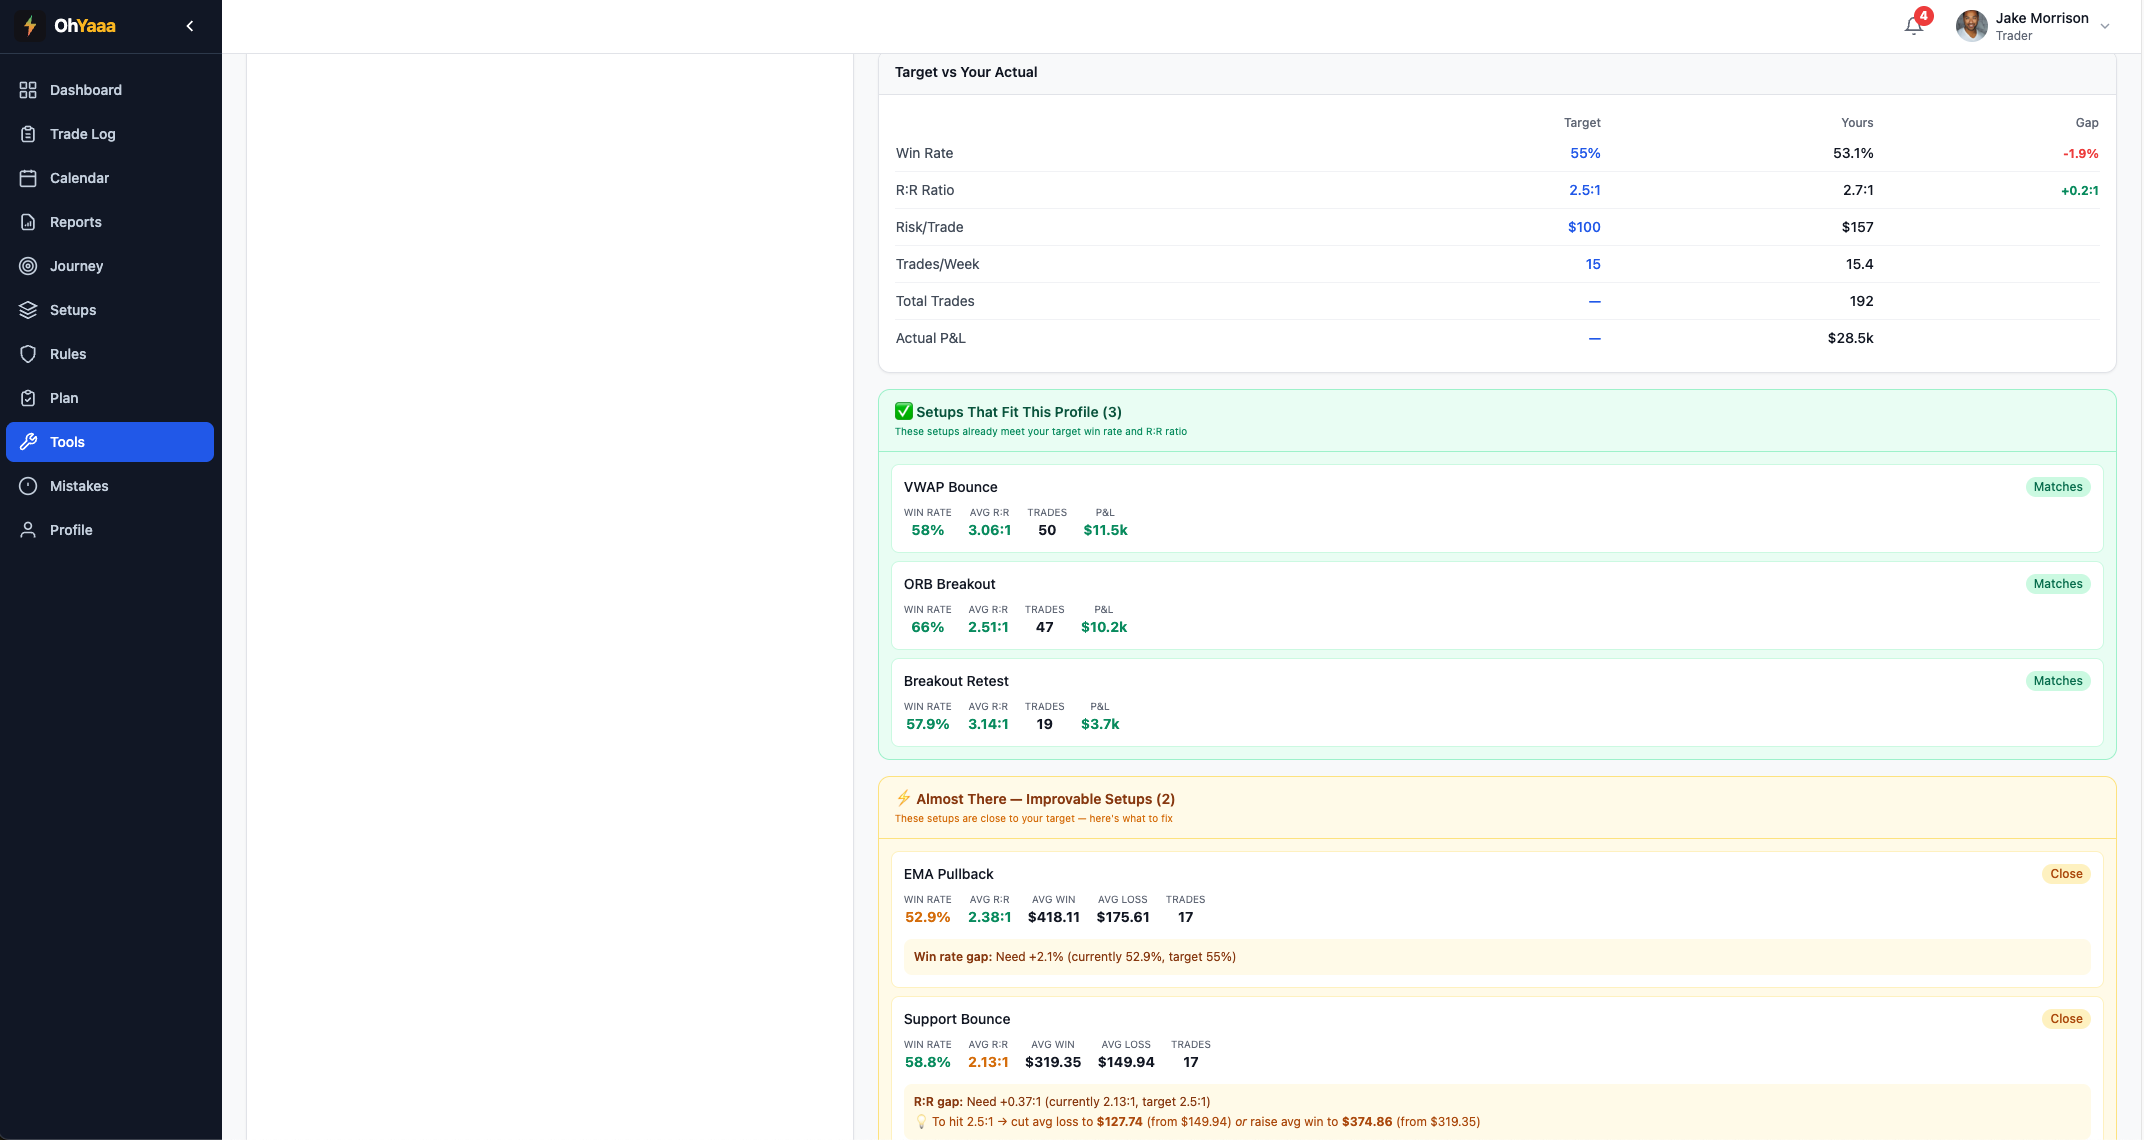
Connects to your real data: shows which setups already fit your target profile and which mistakes are holding you back.
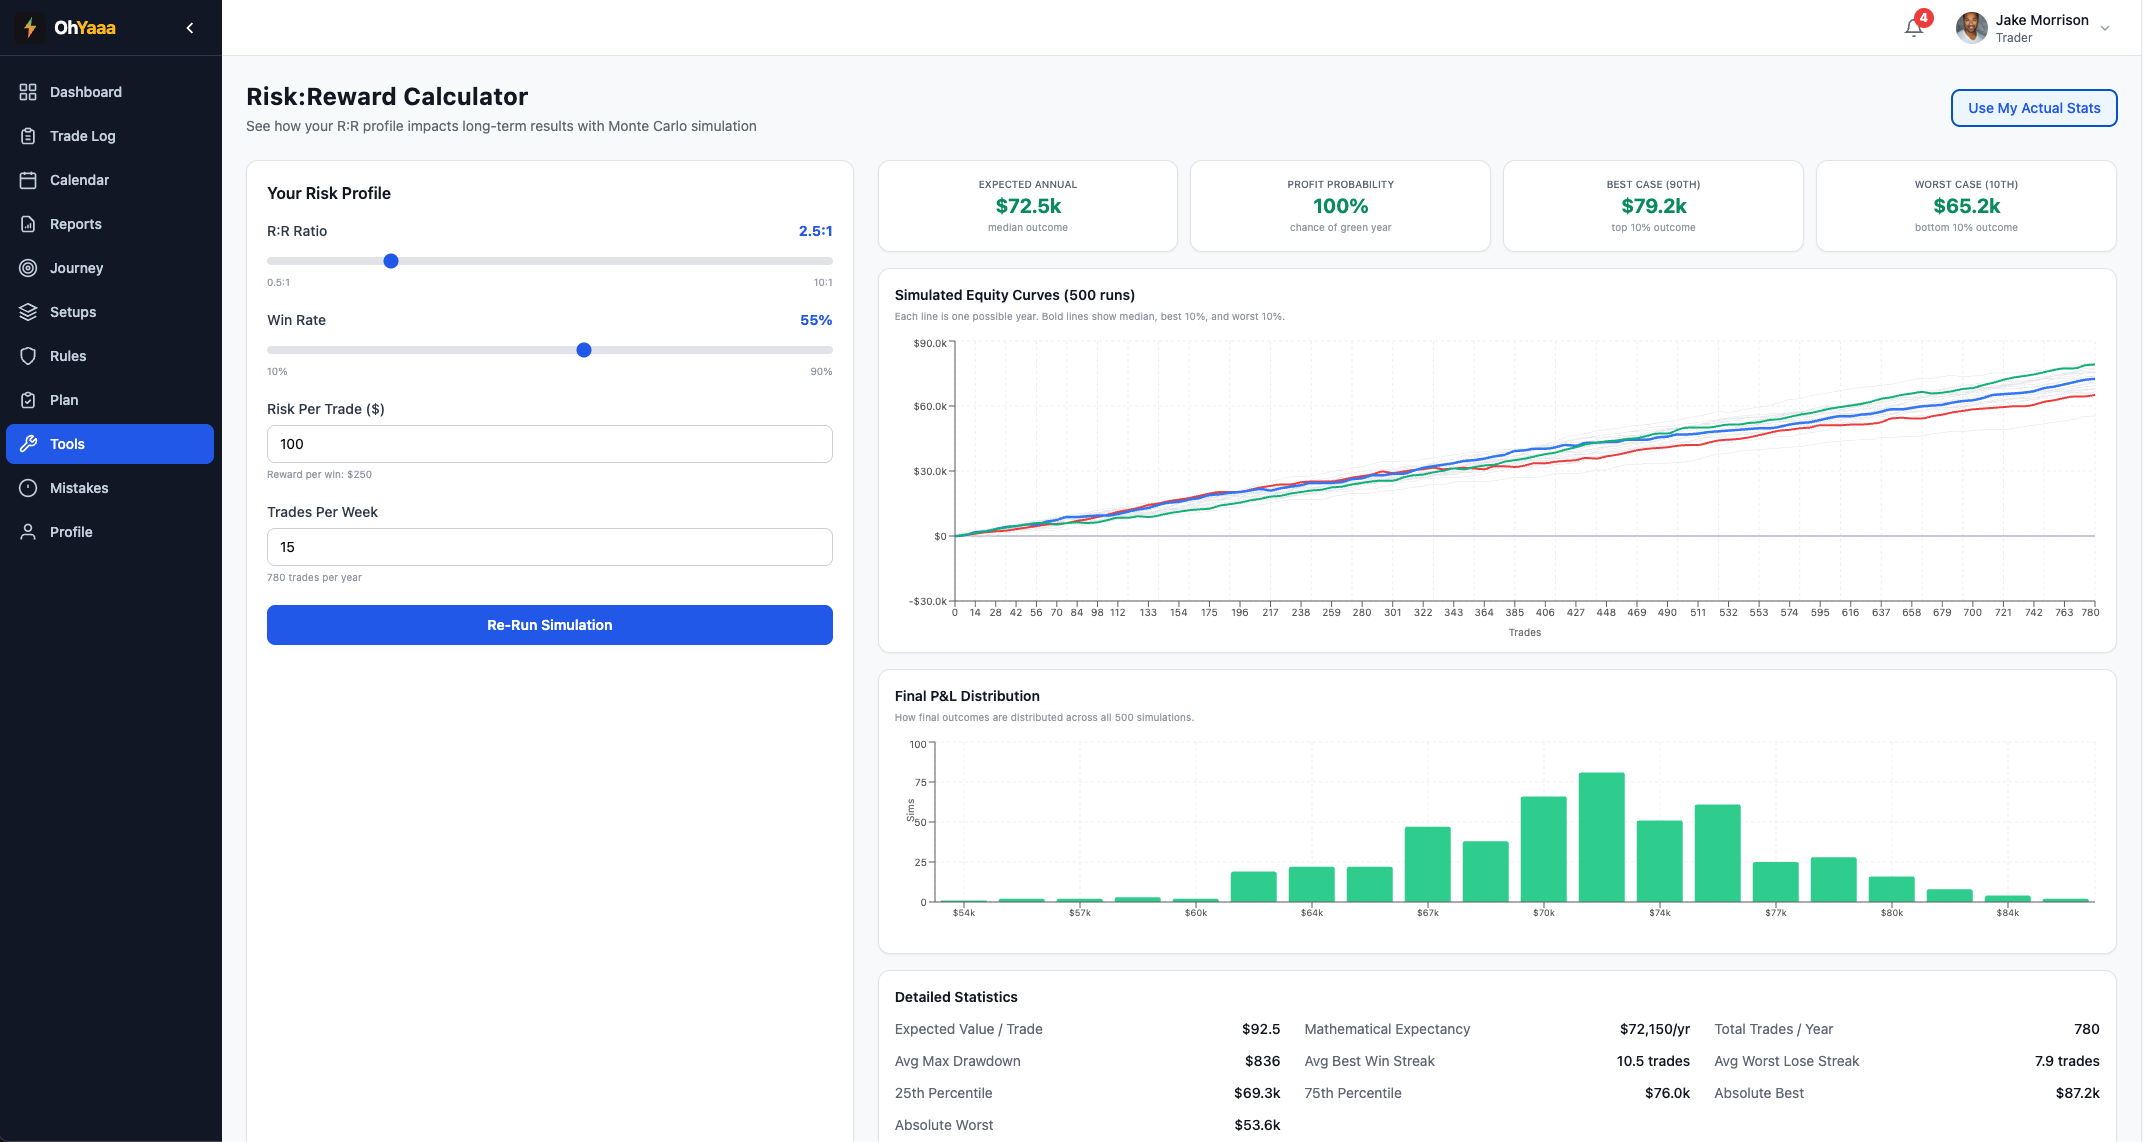
What This Calculator Shows You
Equity Curve Simulation
500 randomized paths showing every possible outcome for your year. See the median result, best 10%, worst 10%, and everything in between.
P&L Distribution
Histogram showing how final outcomes are distributed. Instantly see the probability of hitting your profit target vs. having a losing year.
Key Statistics
Expected annual P&L, probability of profit, average max drawdown, win/lose streaks, and expected value per trade.
Why It Matters
Most traders focus on win rate alone. This calculator proves that a 40% win rate with 3:1 R:R crushes a 70% win rate with 1:1 R:R over time.
How to Use It
- Set your R:R ratio — How much you make on a win vs. how much you lose on a loss (e.g., 3:1 means you win $300 when right, lose $100 when wrong)
- Enter your win rate — What percentage of your trades are winners
- Set your risk per trade — The dollar amount you risk on each trade
- Choose your frequency — How many trades you take per week
- Run the simulation — See 500 possible outcomes for your year