The Numbers Your Broker
Won't Show You.
Profitable traders obsess over the metrics that actually predict their edge. Win rate, profit factor, average winner vs loser, P&L by setup — all calculated automatically. No spreadsheet formulas. Just truth.
See Your Real Numbers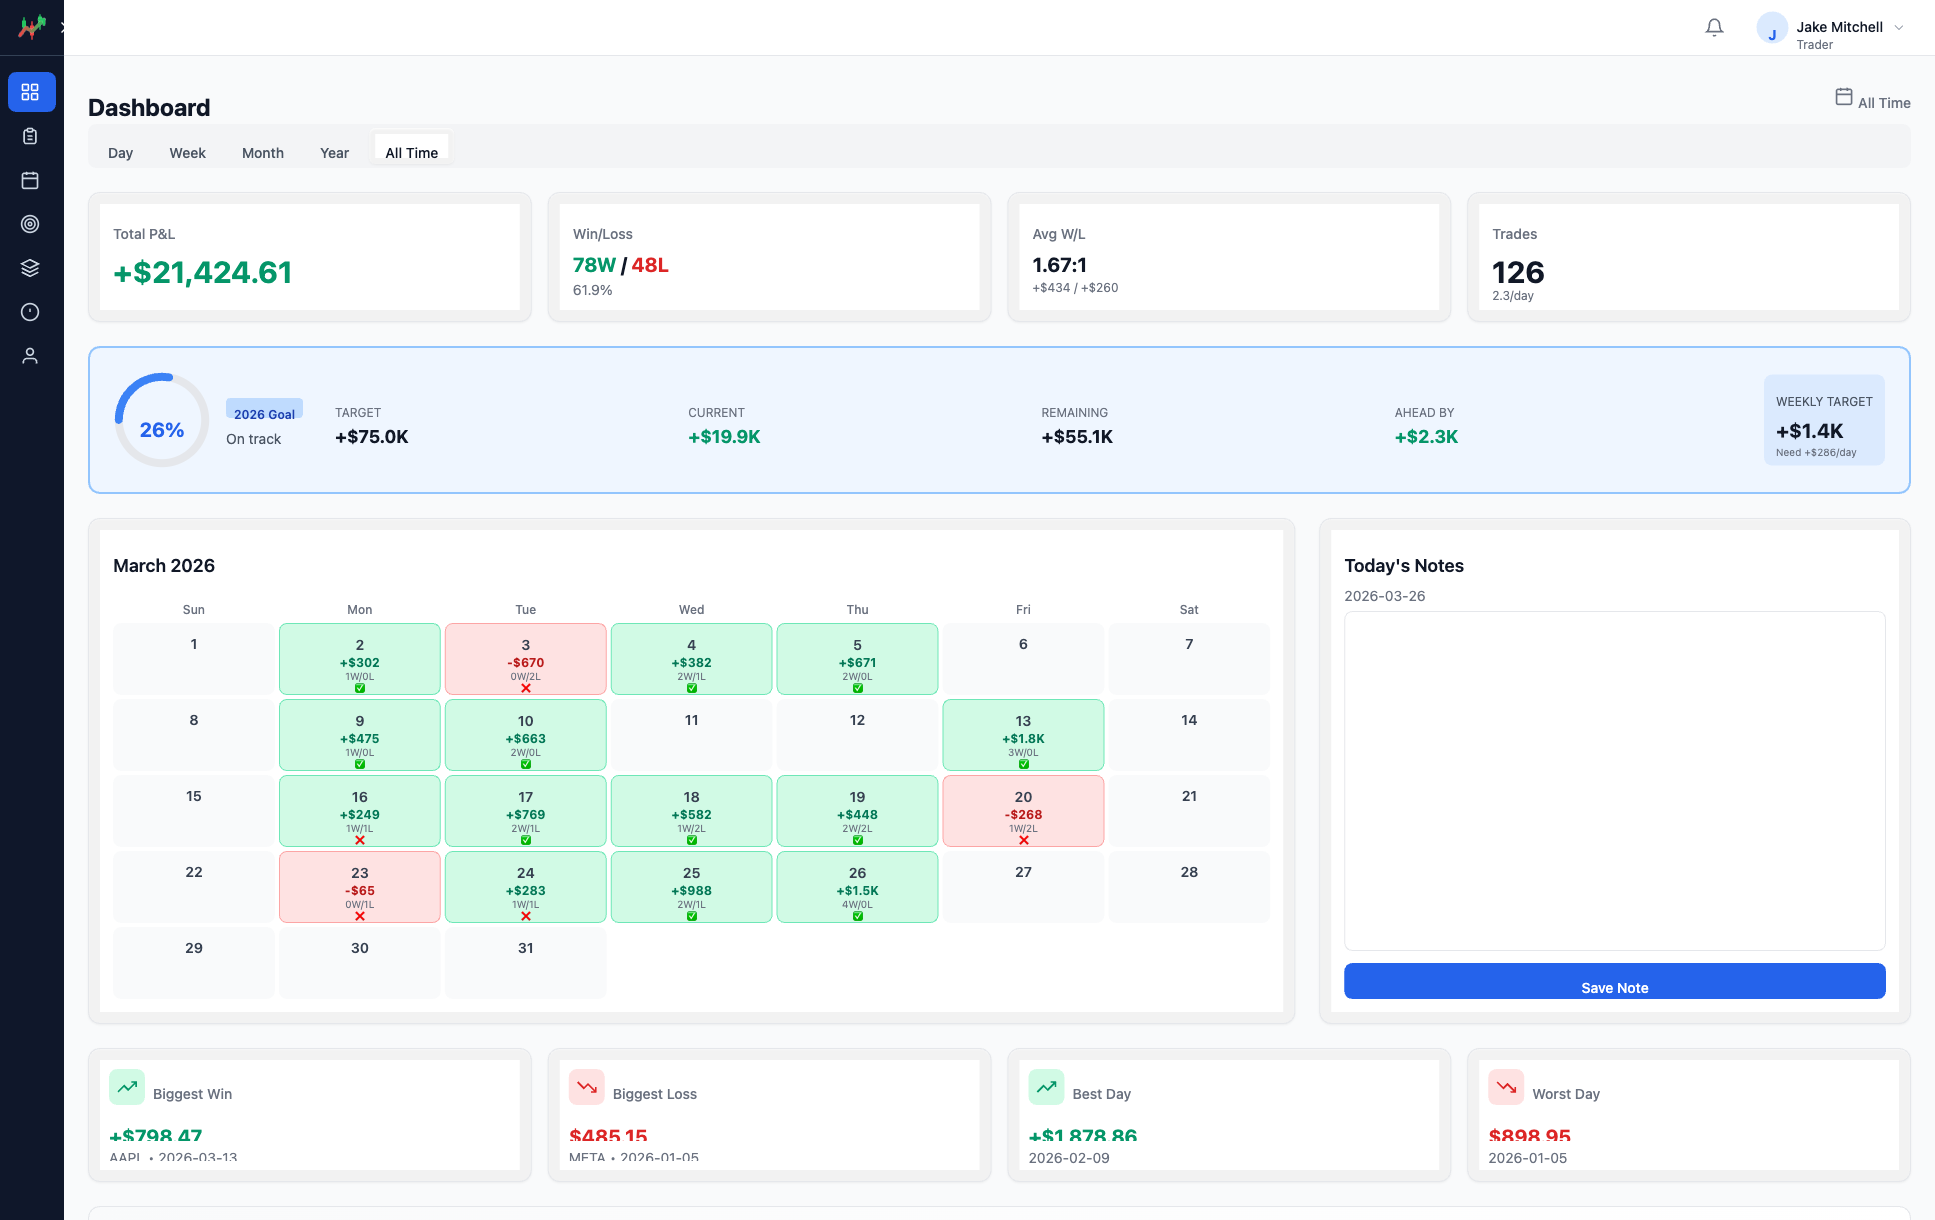
Your broker tells you your P&L. That's it.
It doesn't tell you your profit factor. It doesn't show which setups bleed your account or what your equity curve looks like over three months. You have a feeling about how you're doing. But you can't trade on feelings.
The 5 numbers that matter.
Total P&L, win rate, avg win vs loss, trades count — all updating in real-time as you log. Filter by day, week, month, year, or all time.
- Real-time calculations
- Time-period filtering
- Biggest win, biggest loss, best day
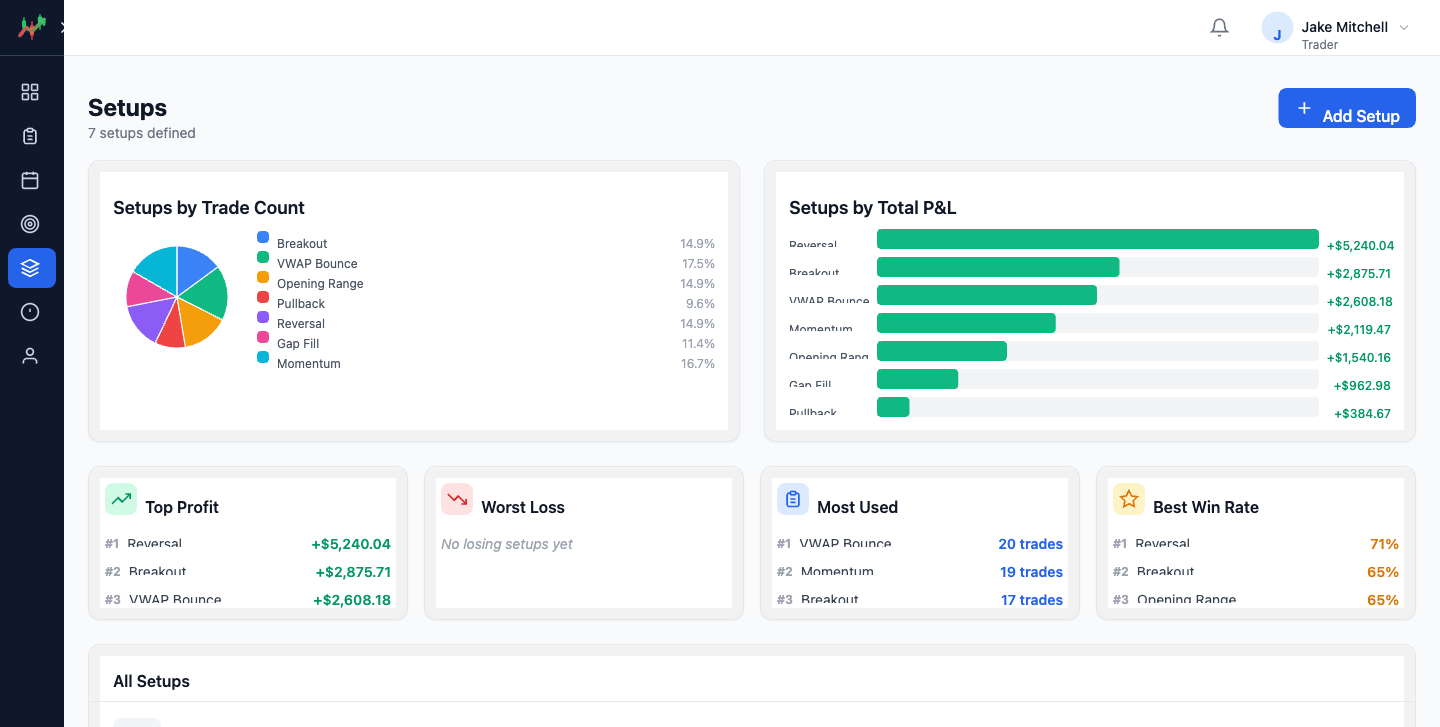
See which playbook is paying you.
See exactly which trading setups make you money. Pie chart by trade count, bar chart by P&L, rankings for most profitable, most used, and best win rate.
- P&L by setup with rankings
- Win rate per strategy
- Most profitable vs most costly
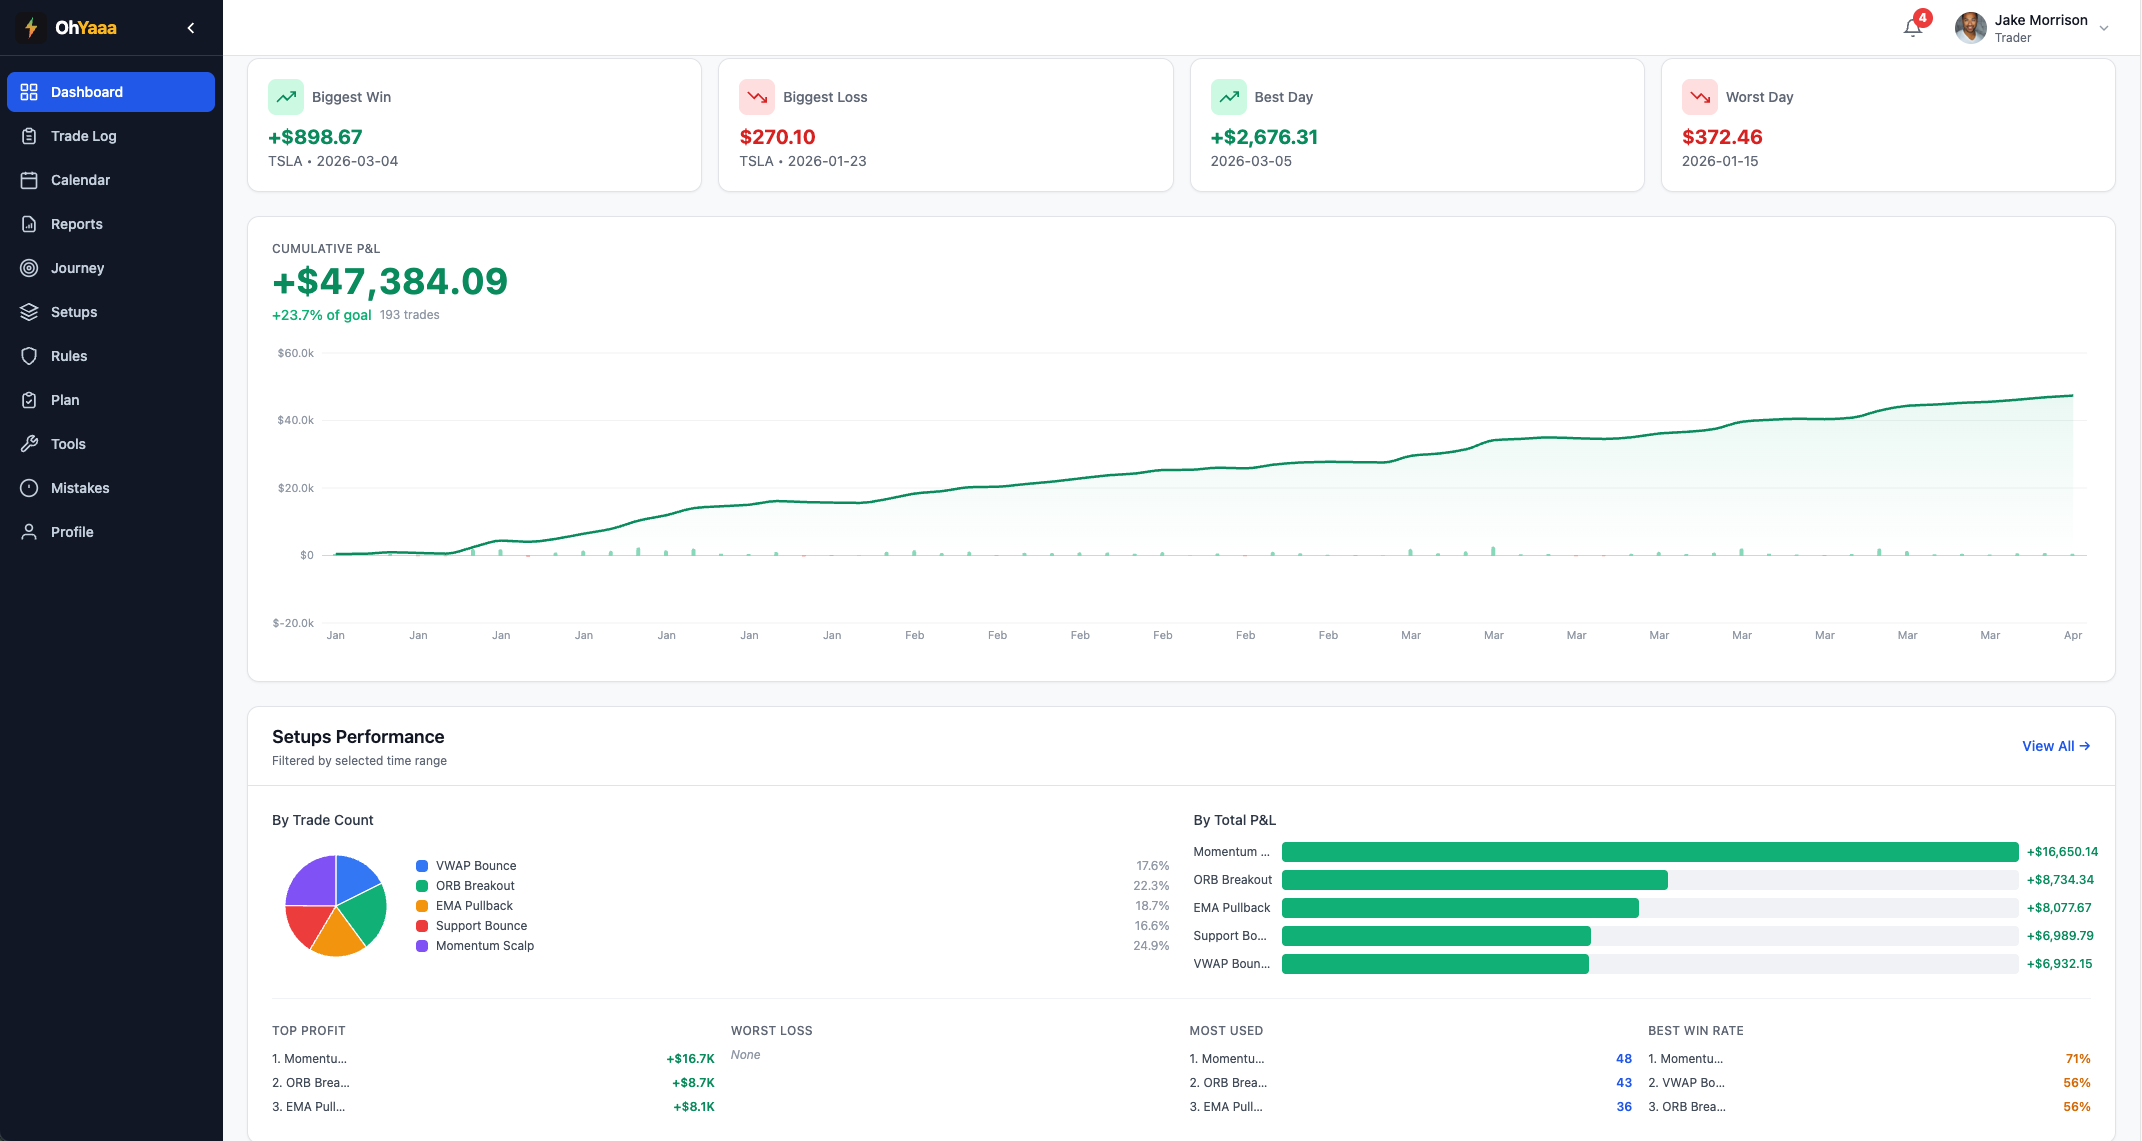
The line that tells you if you have an edge.
Watch your equity curve grow over time. A smooth uptrend means you have an edge. A choppy line means inconsistency. The chart doesn't lie.
- Equity curve visualization
- Spot drawdown periods
- Track consistency over time
What changes when you have real data
Trade on data, not feeling
Every decision backed by your own numbers.
Kill losing strategies faster
See which setups bleed your account. Cut them.
Prove your edge exists
An uptrending equity curve is proof, not hope.
"The dashboard showed me something I never would have found in a spreadsheet — my win rate on Mondays was 38% vs. 67% the rest of the week. I was forcing trades to start the week strong. Once I saw the data, I stopped forcing it and my overall profit factor jumped from 1.2 to 1.8 in two months."
Alex W.
Beginner trader — stocks, 4 months