Your Trading Month,
Decoded in Color.
Profitable traders zoom out every week to see the shape of their performance. Green days. Red days. Patterns you never noticed. See your entire month at a glance and click any day to drill into every trade.
See Your Month in Color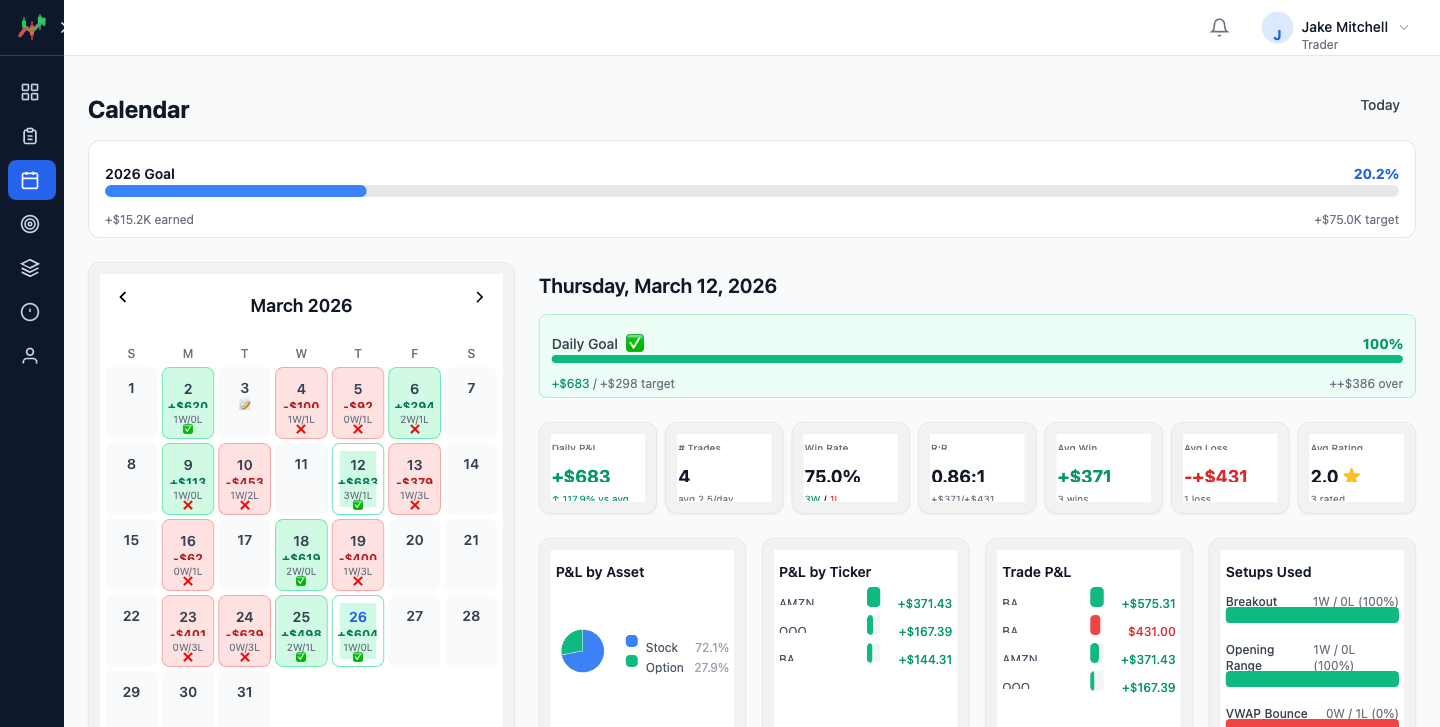
You have a vague sense of how the month went.
Was it good? Bad? You scroll through trade logs trying to piece it together. You remember the big wins and the devastating losses, but the pattern in between — the slow bleed on Mondays, the hot streak mid-week — is invisible.
Every day gets a color based on P&L.
Deep green for strong days. Red for losing days. Gray for rest days. The month's story jumps off the screen.
- P&L amount + win/loss count per day
- Daily goal hit/miss indicators
- Profit/Loss color intensity
One click. Every detail.
Click a day and see everything: daily P&L vs average, win rate, R:R ratio, P&L by ticker, setups used, and every trade in a sortable table. One click.
- Full daily stats panel
- P&L by asset, ticker, and setup
- Individual trade breakdown
Context your future self will thank you for.
Add notes about market conditions, your mindset, lessons learned. Future you will thank you when reviewing a winning streak or a drawdown period.
- Free-form daily notes
- Attached to specific dates
- Review your thought process later
See patterns in seconds
Monday losing streaks. Wednesday hot streaks. The rhythm of your edge.
Daily accountability
Every day gets a color. No hiding from red.
Context for every trade
Notes + data = the full picture.
"The calendar is honestly my favorite feature. I open it every morning before I trade and look at my week. The color coding makes patterns obvious — I noticed I lose money every Friday afternoon, so I stopped trading after 2pm on Fridays. That one change made my last month my best month."
Jason R.
Scalper, NQ futures
Your next month starts with day one.
See Your CalendarNo credit card. No trial. No catch.
Explore other features